This document contains field notes about a specific experiment: using the numeric output of a data analysis process to create 3D visualizations. The idea behind this experiment arises from the question: Are 3D models or 3D viewers relevant to linguistics? In computational linguistics, it is typical to work with a text corpus and apply statistical processes to analyze it. The results of such analyses are mostly displayed or published as 2D diagrams. In this experiment, a pipeline is tested for creating 3D visualizations as an alternative to 2D diagrams.
The idea came to life through discussions between Vyshanta Simha and Enes Türkoglu during the requirement analysis session of the Artest project. The code was created and executed by Vyshanta Simha.
Field Notes:
The Jupyter notebook has to installed locally (or on a server on the network) and then one must execute this command on Terminal to start the Jupyter Notebook :
jupyter notebook --port 8080
The Notebook can be viewed locally as shown in the video below :
http://localhost:8080/tree#notebooks
or alternatively, Jupyter Notebook server instance could via the Network using such an URL –
<Protocol>://<Hostname_or_Full-Qualified-Domain-Name>:<Port>/?token=<Jupyter_Token_Value>
Then a file instance on the Notebook can be viewed locally as shown in the video below :
http://localhost:8080/notebooks/ObjectsIn3D.ipynb
or alternatively, the instance of the file on the Jupyter Notebook server could via the Network using such an URL –
<Protocol>://<Hostname_or_Full-Qualified-Domain-Name>:<Port>/notebooks/<Name_of_File.ipynb>#?token=<Jupyter_Token_Value>
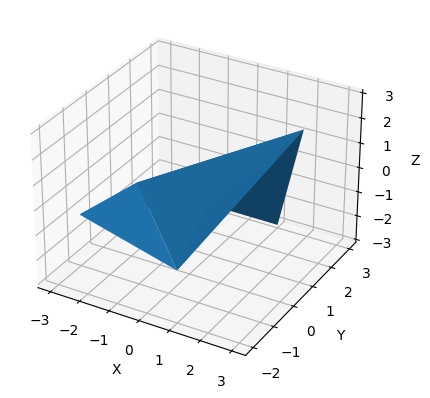
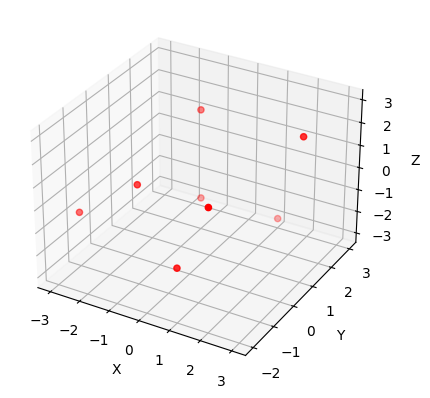
Resulting 3D Visualization
Points in 3D space combined as a Mesh
Once the above 3D points are merged to form a complete shape.

Comparison to how this appears on Kompakkt
Leave a Reply